

Email marketing becomes much more effective when you know exactly what happens after you press Send. Marketing Analytics helps you understand how subscribers interact with your emails, which campaigns generate clicks and conversions, and where your strategy needs improvement.
Instead of relying on assumptions, you can use campaign data to understand what your audience actually responds to. From open and click activity to website visits, conversions, and revenue, the right analytics can turn ordinary email campaigns into a measurable growth channel.
This guide explains how Marketing Analytics works with email marketing, which metrics matter most, how to connect email campaigns with website analytics, and how to use your findings to improve future campaigns.
What Is Marketing Analytics in Email Marketing?
Marketing Analytics is the process of collecting, analyzing, and interpreting marketing data to understand campaign performance and make better decisions.
In email marketing, analytics can show you:
- How many emails were delivered
- How many subscribers interacted with your emails
- Which links received clicks
- Which campaigns generated conversions
- Which audiences responded best
- How much revenue campaigns generated
- How many subscribers unsubscribed
- Which campaigns performed better over time
The purpose is not simply to collect numbers.
The real purpose is to use those numbers to answer important questions.
For example, you might ask:
Did this campaign generate sales?
Which CTA received the most clicks?
Which audience segment converted best?
Did this email generate more revenue than our previous campaign?
This is where analytics becomes a strategic tool instead of just a reporting system.
Why Marketing Analytics Matters for Email Campaigns
Email platforms can provide many different metrics, but not every number deserves equal attention.
A campaign might receive plenty of opens but very few clicks. Another campaign might receive fewer opens but generate significantly more purchases.
That difference is important.
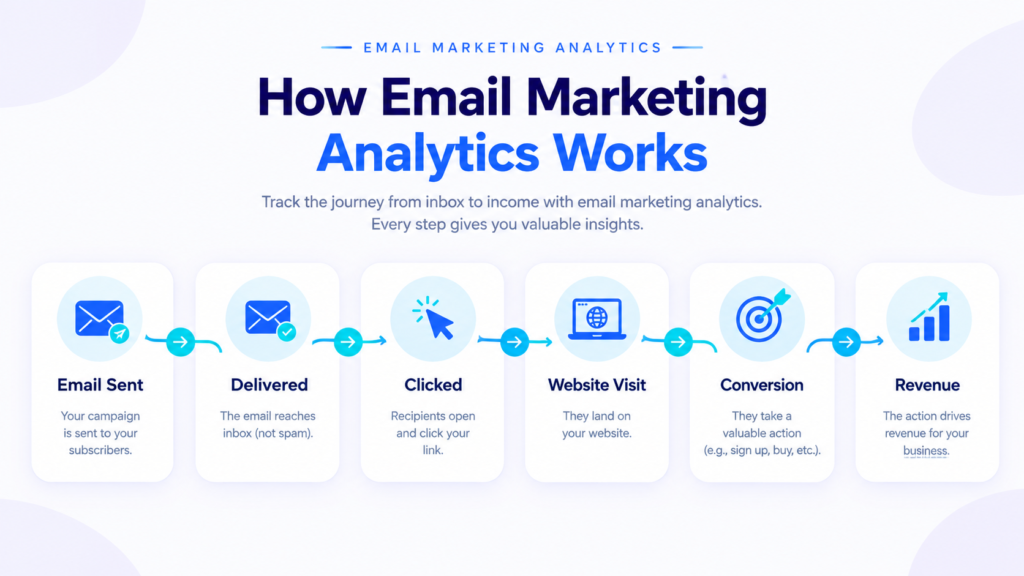
A successful Marketing Analytics strategy looks beyond individual engagement metrics and examines the complete customer journey:
Email → Click → Website Visit → Conversion → Revenue
Google Analytics can use campaign parameters to identify traffic coming from email and other marketing campaigns. This makes it easier to connect campaign traffic with website activity and outcomes. (Google Help)
For example, instead of simply reporting:
“Our email received 500 clicks.”
You can investigate:
“Our email generated 500 clicks, 120 product views, 35 purchases, and $2,800 in attributed revenue.”
The second version gives you much more useful information for future decisions.
Important Email Marketing Metrics
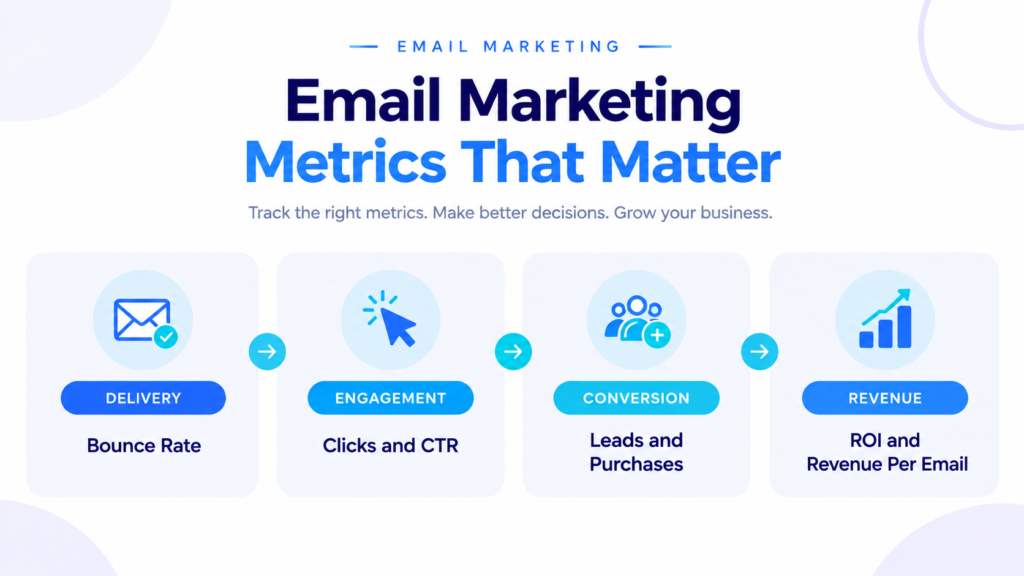
Your Marketing Analytics system should focus on metrics that connect directly to your campaign goals.
Delivery Rate
Delivery rate tells you how successfully your emails reached recipients.
If your emails consistently experience delivery problems, engagement metrics become less useful because subscribers may never receive your messages.
Monitor:
- Delivered emails
- Hard bounces
- Soft bounces
- Spam complaints
A healthy email list and good sending practices help establish a stronger foundation for campaign measurement.
Open Rate
Open rate measures the percentage of delivered emails that were reported as opened.
It can provide useful directional information when comparing campaigns. However, you should not treat it as a perfect measurement of audience engagement.
Email privacy technologies can affect how opens are recorded, so use open rate alongside stronger behavioral metrics such as clicks and conversions.
Click-Through Rate
Click-through rate measures how many recipients clicked a tracked link in your email.
This metric helps you understand whether the email successfully encouraged subscribers to take the next step.
A low click-through rate could indicate problems with:
- The offer
- CTA placement
- Copywriting
- Audience targeting
- Email design
- Content relevance
Mailchimp, for example, defines email click rate as the percentage of delivered emails that registered at least one click. (Mailchimp)
Conversion Rate
Clicks are useful, but conversions often tell you more about business impact.
A conversion could mean:
- Completing a purchase
- Submitting a form
- Booking a call
- Signing up for a service
- Downloading a resource
- Starting a trial
Your Marketing Analytics strategy should connect email activity with the action you actually want users to take.
Unsubscribe Rate
Unsubscribe rate tells you how many subscribers leave your list after receiving an email.
A sudden increase may indicate:
- Irrelevant content
- Excessive email frequency
- Poor targeting
- Misleading subject lines
- Weak audience segmentation
Do not automatically treat every unsubscribe as a disaster. Removing inactive or uninterested subscribers can also improve the overall quality of your audience.
Revenue Per Email
Revenue per email connects your campaign directly with financial performance.
A basic calculation is:
Revenue Per Email = Attributed Revenue ÷ Emails Delivered
This metric works particularly well for ecommerce and promotional campaigns.
Email Marketing ROI
ROI helps you understand whether your email marketing investment produces enough value.
A basic formula is:
ROI = (Revenue − Marketing Cost) ÷ Marketing Cost × 100
Include relevant expenses such as email software, content creation, design, management, and other campaign costs.
How to Track Email Marketing Performance
Effective Marketing Analytics requires consistent tracking.
Start by defining the goal of every campaign.
For example:
| Campaign Goal | Important Metrics |
|---|---|
| Increase website traffic | Clicks, CTR, sessions |
| Generate leads | Clicks, form submissions, conversions |
| Generate sales | Purchases, revenue, ROI |
| Promote content | Clicks, engagement, page views |
| Reactivate users | Click rate, conversions, repeat purchases |
This approach prevents you from tracking dozens of unrelated numbers.
Use Consistent Campaign Naming
Create a consistent naming system for your campaigns.
For example:
newsletter_september_2026
product_launch_september_2026
black_friday_2026
Consistent naming makes reports easier to analyze and compare.
Using GA4 for Email Marketing Analytics
Google Analytics 4 can help connect email traffic with website behavior.
The most important part is using consistent UTM parameters in your email links.
Google recommends using parameters such as:
utm_sourceutm_mediumutm_campaign
You can also use utm_content when you need to distinguish different links or creative variations. (Google Help)
For example:
https://example.com/product?
utm_source=newsletter
&utm_medium=email
&utm_campaign=summer_sale
Here:
- Source: newsletter
- Medium: email
- Campaign: summer_sale
You can use utm_content to distinguish multiple links within the same email.
For example:
utm_content=hero_ctaand:
utm_content=footer_ctaThis allows you to compare which link generated more traffic.
Google Analytics reports campaign and traffic-source dimensions such as source, medium, and campaign name, making consistent UTM naming important for clean reporting. (Google Help)
Why UTM Consistency Matters
Imagine one campaign uses:
utm_medium=email
while another uses:
utm_medium=Email
and another uses:
utm_medium=newsletter
You may end up fragmenting your reporting because these values are treated differently.
Google specifically recommends consistent naming conventions because inconsistent campaign values can split what should be a single marketing effort into separate reporting values. (Google Help)
Track Conversions From Email
Traffic alone does not prove that your campaign worked.
You need to know what users did after arriving on your website.
For example:
Email Click → Product Page → Add to Cart → Purchase
GA4 can measure important actions as events and use important events for conversion measurement. Google notes that conversion measurement can include actions originating from channels such as email, search, and social. (Google Help)
This allows you to move from simple email reporting toward more complete Marketing Analytics.
Instead of asking:
How many people clicked?
You can ask:
How many people clicked and eventually purchased?
That is a much more useful business question.
How to Build an Email Marketing Analytics Dashboard
You do not need an overly complicated dashboard.
Start with four categories.
| Category | Metrics |
|---|---|
| Delivery | Delivered, bounce rate, spam complaints |
| Engagement | Open rate, clicks, CTR |
| Conversion | Leads, purchases, conversion rate |
| Business Results | Revenue, ROI, revenue per email |
This structure makes your reports easier to understand.
Dashboard Section One: Campaign Performance
Track each campaign’s:
- Send date
- Audience size
- Delivery rate
- Click rate
- Conversion rate
- Revenue
Dashboard Section Two: Audience Performance
Compare different subscriber groups.
For example:
- New subscribers
- Returning customers
- Previous purchasers
- Highly engaged users
- Inactive subscribers
This can reveal major differences that an overall campaign average hides.
Dashboard Section Three: Revenue Performance
Connect email campaigns with business outcomes.
Track:
- Revenue
- Average order value
- Purchases
- Revenue per email
- ROI
This section helps demonstrate the financial value of email marketing.
How to Use Data to Improve Email Campaigns
The most important part of Marketing Analytics is turning data into action.
Improve Subject Lines
If one type of subject line consistently produces stronger engagement, test more variations around that approach.
Avoid assuming that one successful subject line will always work.
Instead, identify patterns.
Improve Calls to Action
If emails receive good engagement but few clicks, examine the CTA.
Test:
- CTA wording
- Button placement
- Number of CTAs
- Offer clarity
- Visual prominence
Improve Audience Segmentation
Your entire subscriber list does not have identical interests.
Create segments based on:
- Purchase history
- Content interests
- Engagement
- Customer lifecycle
- Product interest
Then tailor the message to each group.
Test Email Content
A/B testing can help you compare different versions of an email.
Test one major variable at a time, such as:
- Subject line
- CTA
- Offer
- Email layout
- Content length
- Personalization
- Send time
This makes the results easier to interpret.
Common Marketing Analytics Mistakes
Even businesses that collect plenty of data can make analytics mistakes.
Focusing Only on Open Rate
Open rate can provide useful information, but it should not define campaign success.
Look at clicks, conversions, and business outcomes too.
Tracking Too Many Metrics
More numbers do not automatically mean better analysis.
Focus on the metrics that connect directly to your campaign objective.
Ignoring UTM Parameters
Without consistent campaign tracking, email traffic can become harder to identify correctly in website analytics.
Google notes that missing UTM parameters can cause traffic-source information to be lost or appear as direct traffic. (Google Help)
Comparing Different Audiences
A campaign sent to existing customers should not automatically be compared with a campaign sent to brand-new subscribers.
Audience differences can significantly affect performance.
Making Decisions From One Campaign
One email does not provide enough evidence for every strategic decision.
Look for patterns across multiple campaigns.
A Simple Marketing Analytics Workflow
Use this repeatable process for every major email campaign:
Step 1: Define the Goal
Decide what the campaign needs to achieve.
Step 2: Select KPIs
Choose three to five metrics that directly measure that goal.
Step 3: Add Tracking
Use consistent UTM parameters and conversion tracking.
Step 4: Send the Campaign
Allow enough time for meaningful data to accumulate.
Step 5: Analyze the Results
Compare engagement, traffic, conversions, and revenue.
Step 6: Identify Opportunities
Find the strongest and weakest points in the customer journey.
Step 7: Test Improvements
Change one important variable and measure the outcome.
Step 8: Apply the Learning
Use successful findings in future campaigns.
This turns analytics into an ongoing improvement cycle.
Frequently Asked Questions About Marketing Analytics
What is Marketing Analytics in email marketing?
Marketing Analytics is the process of collecting and analyzing email campaign data to understand performance, audience behavior, conversions, and business results.
Which email marketing metrics should I track?
Start with delivery rate, click-through rate, conversion rate, unsubscribe rate, revenue per email, and ROI. Open rate can also provide useful directional information.
How does GA4 track email campaigns?
GA4 can identify email traffic when campaign URLs contain appropriate UTM parameters such as utm_source, utm_medium, and utm_campaign. These values help Analytics categorize and report campaign traffic. (Google Help)
Why are UTM parameters important for email marketing?
UTM parameters help identify where website traffic came from. Consistent tagging makes it easier to distinguish email campaigns and analyze their website performance. (Google Help)
How can Marketing Analytics improve email campaigns?
It can reveal which audiences, messages, CTAs, offers, and campaigns produce stronger engagement and conversions. You can then use those insights to create and test better campaigns.
Should I focus on clicks or conversions?
Use both, but conversions usually provide stronger evidence of business impact when your campaign goal involves leads, purchases, registrations, or another valuable action.





Leave a response