

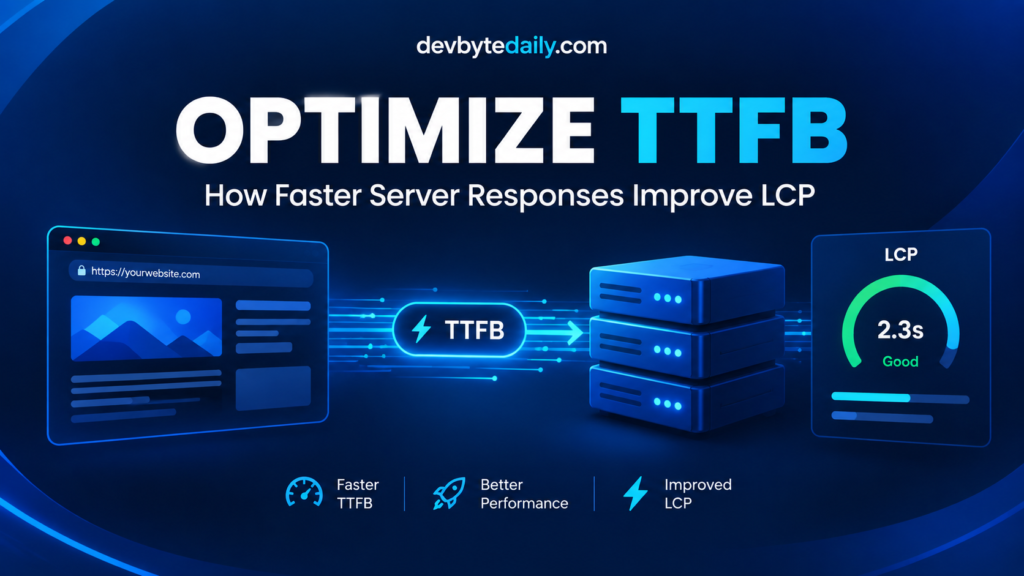
A website can have optimized images, clean code, and lightweight pages, yet still feel slow. One common reason is that the browser spends too much time waiting for the server to respond.
This is where Optimize TTFB becomes important. TTFB, or Time to First Byte, measures how quickly a browser starts receiving a response from a server. A high TTFB can delay the rest of the page-loading process and make it harder to achieve a fast Largest Contentful Paint, or LCP.
In this guide, you will learn what TTFB means, why it matters for LCP, how to measure it, and practical ways to reduce it.
What Is TTFB?
TTFB stands for Time to First Byte. It measures the time between a browser making a request and receiving the first byte of the server response.
When someone visits a webpage, the browser sends a request to the website’s server. The server then processes the request and starts sending information back.
TTFB measures how long the visitor waits before that response begins arriving.
A simple request can involve several stages:
Browser Request → DNS → Connection → Server Processing → First Byte
The exact time depends on the website’s infrastructure, network conditions, server location, caching, database performance, and application code.
According to Google, TTFB includes multiple components such as redirects, DNS lookup, connection setup, TLS negotiation, and server processing. This means TTFB is broader than simply measuring how quickly your backend code runs.
How TTFB Works
Understanding the request process makes TTFB easier to optimize.
Imagine a visitor opens a product page.
First, the browser needs to find the server. It may perform DNS resolution and establish a connection. If HTTPS is used, the browser also performs TLS negotiation.
Next, the server processes the request. It may need to run application code, query a database, retrieve cached information, or communicate with another service.
Finally, the server begins sending the response.
The time until that first byte arrives contributes to TTFB.
For example, a page might have the following sequence:
| Stage | Example Delay |
|---|---|
| DNS and connection | 150 ms |
| Server processing | 400 ms |
| Response begins | 550 ms |
| TTFB | 550 ms |
These numbers are only an example. Real-world performance varies significantly between websites and users.
The important point is that the browser cannot fully process the HTML response until the server starts delivering it.
Why TTFB Matters for LCP
TTFB matters because it happens near the beginning of the page-loading process.
LCP measures how long it takes for the largest visible content element in the viewport to render. This element could be a large image, heading, video poster, or another prominent element.
A slow TTFB can create a delay before the browser receives the HTML that tells it what resources it needs.
For example:
Slow TTFB → HTML arrives late → LCP resource is discovered late → LCP happens later
This does not mean TTFB is the only factor affecting LCP.
A page can have excellent TTFB but poor LCP because of a large image, render-blocking CSS, JavaScript, slow resource loading, or delayed discovery of the main content.
Google recommends looking at the different parts of LCP rather than treating one metric as the entire performance problem.
TTFB and the LCP Timeline
Consider a simplified example:
0 ms
Visitor requests page
1200 ms
First byte arrives
1800 ms
LCP image starts loading
3200 ms
LCP element renders
In this example, the server already consumes 1.2 seconds before the browser can continue with important page-loading work.
Reducing TTFB can therefore create more time for the browser to load and render the LCP element.
What Is a Good TTFB?
Google’s web performance guidance suggests aiming for a TTFB of around 800 milliseconds or less as a rough target.
However, you should not treat 800 milliseconds as a strict ranking requirement.
TTFB is not one of Google’s Core Web Vitals. It is a supporting performance metric that can influence how quickly other loading events occur.
A useful general reference is:
| TTFB | General Guidance |
|---|---|
| 800 ms or less | Good target |
| 800 ms to 1.8 seconds | Needs improvement |
| More than 1.8 seconds | Poor |
These values should help you identify potential problems rather than become a reason to optimize blindly.
Your actual goal should be to reduce unnecessary server and network delays while improving the overall user experience.
How to Optimize TTFB
Now let’s look at practical ways to optimize TTFB and create a faster foundation for LCP.
1. Use Effective Page Caching
Caching is one of the simplest ways to reduce server processing time.
Without caching, a server may need to generate the same webpage repeatedly. It might run application code, query a database, load content, and construct the HTML for every request.
A page cache can store the generated HTML and serve it directly to later visitors.
Instead of:
Request → Application → Database → HTML Generation → Response
the process can become:
Request → Cache → Response
This can significantly reduce the work required from the origin server.
For WordPress websites, configure full-page caching for pages that do not require real-time personalized content.
2. Use a Content Delivery Network
A Content Delivery Network, or CDN, distributes cached content across multiple locations.
When visitors request cached content, the CDN can serve it from infrastructure that is geographically closer to them.
This can reduce network latency and improve response times.
A CDN is particularly useful when your audience is spread across different countries or regions.
However, a CDN does not automatically solve every TTFB problem. If the CDN needs to contact a slow origin server for every uncached request, the underlying backend problem can remain.
Therefore, combine CDN caching with origin-server optimization.
3. Improve Server Performance
Your hosting environment directly affects your ability to optimize TTFB.
A server with limited resources can struggle when multiple visitors make requests at the same time.
Review your:
- CPU resources
- RAM
- Storage performance
- Database performance
- Server location
- Runtime version
- Server-side caching
- Traffic capacity
If your server regularly experiences resource limitations, upgrading infrastructure may improve response times.
However, upgrading hosting should not replace proper diagnosis. A poorly optimized application can remain slow even on powerful infrastructure.
4. Optimize Database Queries
Dynamic websites often depend heavily on databases.
A page might require several queries before the server can generate the final HTML. Poorly optimized queries can increase processing time and delay the response.
Look for:
- Unnecessary database queries
- Missing indexes
- Large database operations
- Repeated queries
- Unused data retrieval
- Plugins that generate excessive database requests
Reducing unnecessary database work can help lower backend processing time.
For example, if a page repeatedly requests the same information, caching that information can prevent the server from performing the same operation again.
5. Reduce Redirects
Redirects add extra steps to the request process.
For example:
URL A → URL B → URL C
takes longer than:
URL A → Final Page
Review your internal links and make sure they point directly to the final URL whenever possible.
Also check HTTP to HTTPS redirects, www and non-www configuration, outdated URLs, and unnecessary redirect chains.
Reducing avoidable redirects can improve the time before the final page response begins.
6. Choose the Right Server Location
Physical distance still matters.
If your visitors are primarily located in Asia but your origin server is located on another continent, network latency can increase.
Choose a hosting region that makes sense for your primary audience.
If you have a global audience, a CDN can help distribute cached resources closer to users.
Server location alone will not fix a poorly optimized backend, but it can remove unnecessary network delay.
7. Improve Cache Hit Rates
Caching works best when visitors actually receive cached responses.
A low cache hit rate can happen because of:
- Dynamic pages
- Cookies
- Query parameters
- Personalized content
- Incorrect cache rules
- Frequent cache purging
- Poor CDN configuration
Analyze which pages can safely remain cached.
You do not need to cache every request. Instead, identify pages that can use cached HTML and separate them from pages that genuinely require dynamic processing.
A higher cache hit rate can reduce the number of requests reaching your origin server.
8. Reduce Unnecessary Backend Work
Another effective way to optimize TTFB is to simplify what happens before the server sends the response.
Ask whether every operation is necessary.
For example:
- Can an API request happen later?
- Can a calculation be performed ahead of time?
- Can repeated data be cached?
- Can unnecessary middleware be removed?
- Can multiple database queries be combined?
- Can unused plugins or extensions be removed?
The less work the server performs during the initial request, the sooner it can begin sending the response.
9. Use Modern Delivery Technologies
Modern web infrastructure provides additional ways to improve response performance.
Depending on your website and hosting architecture, consider technologies such as HTTP/2, HTTP/3, edge caching, server-side rendering, static generation, and Early Hints.
These techniques are not necessary for every website.
Start with the biggest bottleneck shown by your performance data and introduce more advanced solutions only when they provide a measurable benefit.
How to Measure TTFB?
Before you optimize TTFB, establish a baseline.
Otherwise, you cannot confidently determine whether your changes improved performance.
PageSpeed Insights
Google PageSpeed Insights provides performance information for individual pages and can help identify server response issues.
Chrome DevTools
Open Chrome DevTools and select the Network tab.
Reload your webpage and select the main document request. The timing information can show how long the browser spends waiting for the response.
WebPageTest
WebPageTest provides detailed waterfall information that can help you understand how server response time contributes to the overall loading process.
Chrome User Experience Report
CrUX provides real-user performance data for eligible websites.
Real-user data is valuable because laboratory tests cannot perfectly represent every visitor’s device, network, or geographic location.
TTFB vs LCP
TTFB and LCP measure different parts of the loading experience.
| Metric | What It Measures | Main Focus |
|---|---|---|
| TTFB | Time until the first response byte arrives | Server and network response |
| FCP | Time until the first visible content appears | Initial rendering |
| LCP | Time until the largest visible content renders | Main content loading |
TTFB happens earlier than LCP.
This makes it an important diagnostic metric, but improving TTFB alone does not guarantee a good LCP.
For example, suppose your TTFB is 500 milliseconds, but your LCP is 4 seconds.
The server might not be the biggest problem.
Your LCP image could be too large, CSS could block rendering, or JavaScript could delay the final rendering.
In that situation, image optimization and render-path improvements may provide a bigger benefit than further reducing TTFB.
Common TTFB Optimization Mistakes
Focusing Only on Hosting
Moving to faster hosting can help, but it cannot compensate for inefficient application code or database queries.
Treating TTFB as a Ranking Score
TTFB is a performance metric, not a standalone Google ranking score.
Use it to diagnose loading problems rather than chase an arbitrary number.
Testing From Only One Location
Your visitors may experience completely different network conditions.
Use real-user data and multiple test locations when possible.
Ignoring Cache Configuration
Installing a CDN or caching plugin does not guarantee that your pages are being served from cache.
Check your actual cache behavior.
Optimizing TTFB Without Checking LCP
Your website can have a reasonable TTFB and still suffer from poor LCP.
Always look at the complete loading sequence.
Frequently Asked Questions
What is TTFB?
TTFB stands for Time to First Byte. It measures the time between a browser making a request and receiving the first byte of the response.
Does TTFB affect LCP?
Yes. A slow TTFB can delay the arrival of HTML and postpone the browser’s ability to discover and load important content. This can contribute to a slower LCP.
What is a good TTFB?
Google’s web performance guidance suggests approximately 800 milliseconds or less as a rough target. However, TTFB should not be treated as a strict ranking requirement.
How can I optimize TTFB?
You can optimize TTFB by improving caching, using a CDN, optimizing database queries, reducing redirects, improving server performance, choosing an appropriate server location, and reducing unnecessary backend work.
Is TTFB a Core Web Vital?
No. TTFB is not one of Google’s Core Web Vitals. However, it is an important supporting metric because it occurs early in the page-loading process.
Can improving TTFB improve LCP?
Yes, it can. Reducing TTFB gives the browser an earlier opportunity to receive HTML and begin the rest of the loading process. However, other LCP problems may still need separate optimization.
What tools can measure TTFB?
PageSpeed Insights, Chrome DevTools, WebPageTest, and real-user performance data from Chrome User Experience Report can help you analyze TTFB.
Should I optimize TTFB or LCP first?
Look at the complete performance breakdown. If TTFB creates a significant initial delay, optimize it. If TTFB is already reasonable but the LCP resource loads or renders slowly, focus on the specific LCP bottleneck instead.





Leave a response